When a product is shipped from East Asia to Europe, it can typically be tracked via a waybill, allowing the carbon emissions from its transport to be estimated. However, when the scope expands from a single trade flow to all products across all global trade pairs, the problem becomes far more complex: Do identical products adopt different transport modes across countries? How much variation exists in transport mode choices among different products? For a long time, a systematic assessment of CO₂ emissions from international trade-related transport and their distribution patterns at the global scale has remained unclear. Addressing these questions, the research group led by Professor Liu Huan from the Joint Pollution Control and Carbon Reduction Research Center, Institute for Carbon Neutrality, Tsinghua University, and the School of Environment, Tsinghua University, developed a machine learning-based analytical framework covering 65 economies, approximately 1.9 million bilateral trade flows, and 1,221 product categories. This framework estimates the modal shares of maritime shipping, aviation, road, and rail transport for each product category within bilateral trade flows. Based on this, the study quantified CO₂ emissions from international trade-related transport. The multi-scale modal share data reveal heterogeneity in CO₂ emissions across different scales while highlighting cognitive discrepancies in emission attribution. Furthermore, the study explores carbon emission reduction potential from the perspective of trade optimization.
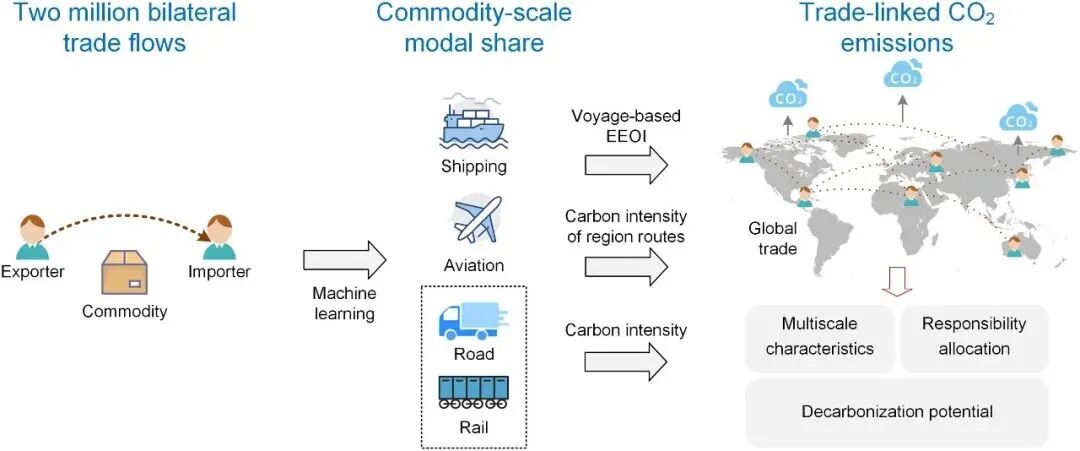
Figure 1. Research design flowchart
When it comes to international trade transport, many people's first thought is that maritime shipping dominates. This study shows that, at the regional average scale, maritime shipping is indeed the primary mode for international trade. For most inter-regional trade flows, maritime shipping accounts for over 90% of modal share; only between regions with close land connections and convenient cross-border transport, such as within Europe, does road transport take a higher share (Figure 2A). However, when refining the scale from regional to national, and even down to the product level, this "maritime dominance" impression does not always hold. The study finds that even within the same region, transport structures can vary significantly across countries. For example, in East Asia–Eastern Europe trade, regional averages suggest maritime and road transport dominate; but for island nations like Japan, imports and exports are almost entirely dependent on maritime shipping and aviation (Figure 2B). At the product scale, these differences become even more pronounced (Figure 2C). This demonstrates that global trade transport is never a single mode but rather a complex system shaped jointly by product characteristics, time sensitivity, transport distance, and geographic accessibility.
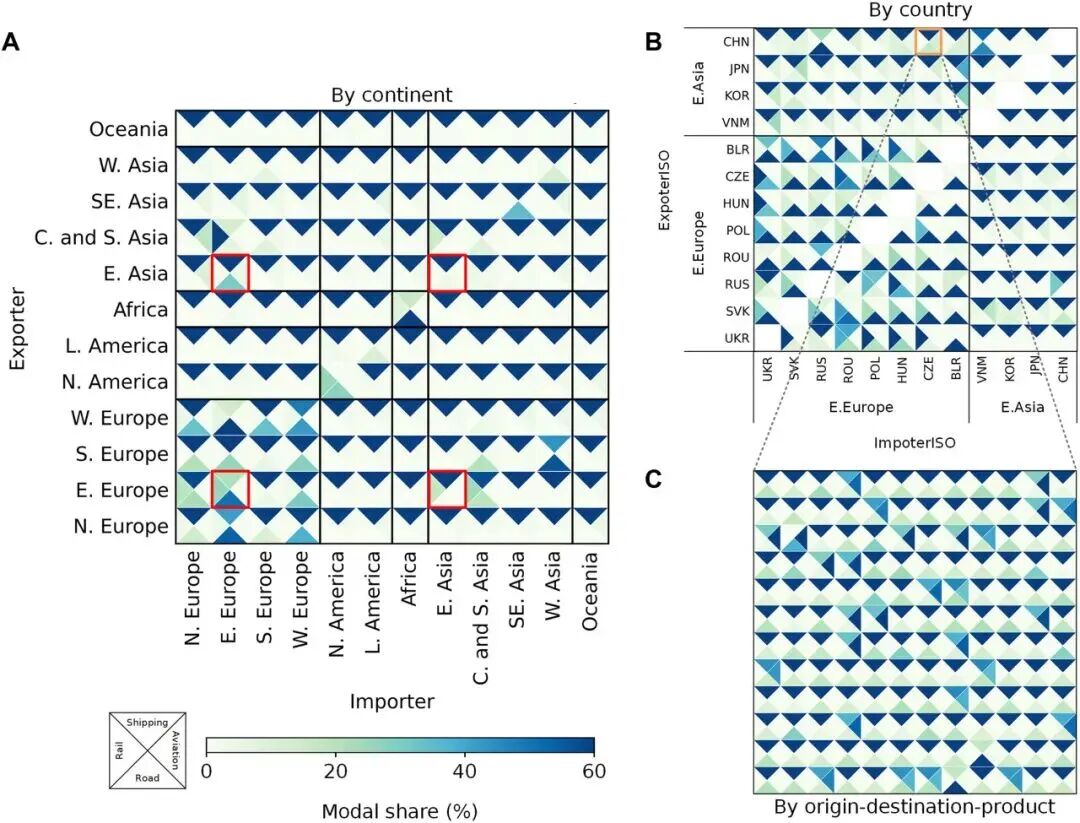
Figure 2. Transport mode shares at different scales in international trade
(A) Regional scale; (B) Country scale for East Asian and Eastern European countries; (C) Top 144 traded products by weight in the China–Czech Republic (CHN-CZE) trade pair, shown by HS four-digit code (from left to right, bottom to top).
Note: "Share" in the figure refers to the allocation ratio of products across maritime, aviation, road, and rail modes for each bilateral trade flow. These shares are directly aggregated means at different scales, not weighted by cargo weight, value, or turnover.
In 2021, direct CO₂ emissions from global international trade-related transport amounted to approximately 971 million tons, accounting for 12.6% of total global CO₂ emissions from the transport sector. Among these, maritime shipping is the largest emission source; although aviation handles lower volumes, its higher carbon intensity means it still contributes 19% of emissions. Road transport emissions are concentrated mainly within regions and areas with highly connected land transport networks (Figure 3A). Looking at a longer time scale, emissions from international trade-related transport have not spiraled out of control in tandem with global trade expansion: in 1995, these emissions were approximately 1.016 billion tons of CO₂, representing 19.2% of global transport CO₂ emissions; by 2021, this share had fallen to 12.6%. This suggests that, despite continued global trade growth, improvements in transport efficiency have to some extent offset the emission pressures from trade expansion (Figure 3B). The pattern of emissions from international trade-related transport is the result of multiple interacting factors, depending not only on trade volume but also on how trade is realized—including time sensitivity determined by product characteristics, competition among transport modes, and the spatial organization of trade linkages (Figure 3C). Therefore, understanding emissions from international trade-related transport cannot be confined to aggregate volumes but must be incorporated into an analytical framework that couples products, transport modes, and spatial structure.
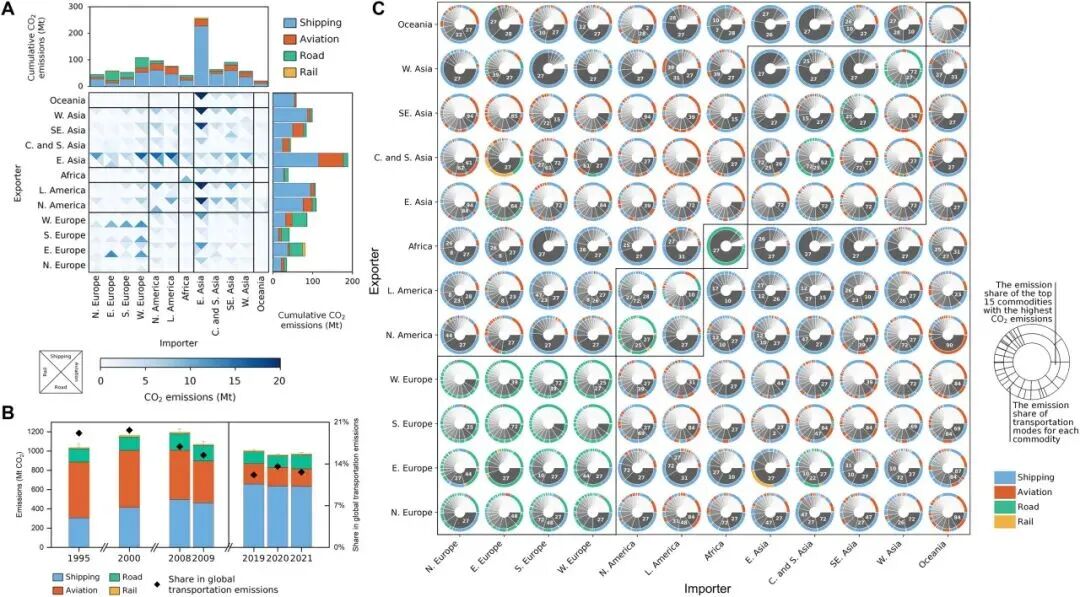
Figure 3. CO₂ emissions from international trade-related transport
(A) Structure of CO₂ emissions from international trade-related transport at the regional scale; (B) Changes in CO₂ emissions from international trade-related transport, 1995–2021; (C) Regional trade-related transport CO₂ emissions by product and transport mode.
The study compares the impact of using transport mode shares at regional, national, and product scales on emission estimation results. The findings show that if only global aggregates are considered, differences among methods are relatively small; however, when focusing on specific countries or product categories, biases expand significantly. For example, at the national level, using regional average transport structures instead of actual national structures tends to overestimate emissions for countries that rely more on lower-carbon modes. China, Brazil, and Russia are typical cases, as the regional average approach tends to amplify the share of higher-carbon modes such as aviation. Conversely, for countries like Canada, which rely heavily on road transport with the United States, the regional average approach underestimates the road transport share and thus underestimates actual emissions. Overall, national-level biases range from −7 to +17 Mt, with relative deviations up to 140% (Figure 4A). Product-level biases are also significant, with emissions from bulk commodities often overestimated and emissions from high-value manufactured goods underestimated (Figure 4B). This bias is not a simple averaging error but is further amplified by significant differences in carbon intensity among transport modes, particularly for countries or product categories highly dependent on aviation.
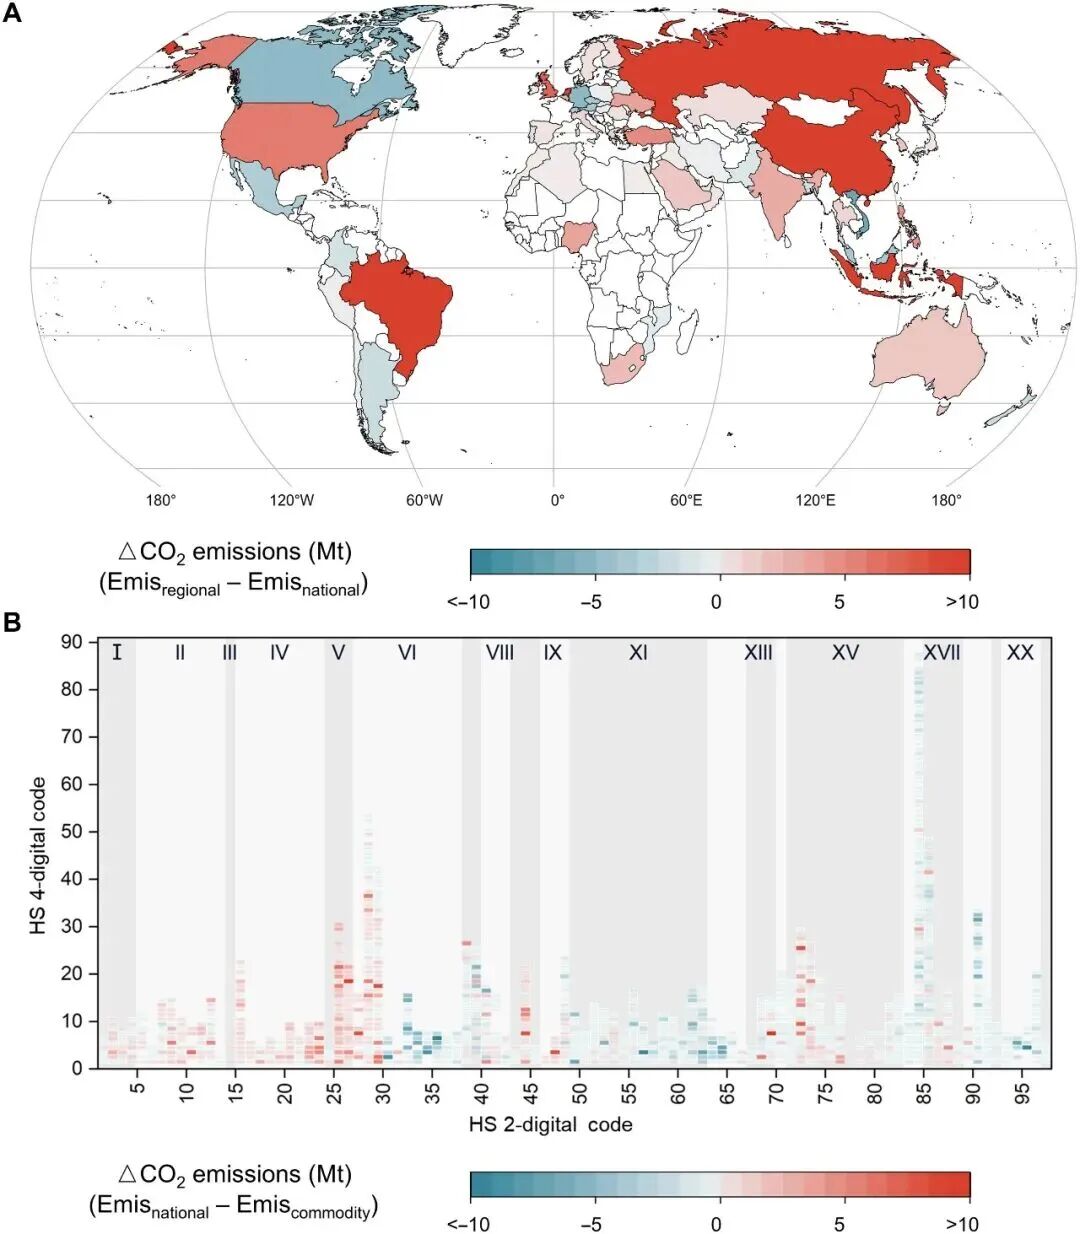
Figure 4. Cognitive discrepancies in CO₂ emissions from international trade-related transport due to simplified transport mode shares
(A) Differences in national CO₂ emissions calculated using regional-scale versus country-scale transport mode shares (regional scale – country scale); (B) Differences in product CO₂ emissions calculated using country-scale versus product-scale transport mode shares (country scale – product scale).
For international transport emission reduction, the most common approaches are improving energy efficiency, optimizing operations, and promoting alternative fuels. This study proposes a new perspective: optimizing trade distance from the "demand side." The study constructs an idealized scenario in which, without changing broad product categories, countries are incentivized to prioritize trading identical products with trading partners at shorter distances and with more efficient routes. The results show that if such trade optimization were achieved, global CO₂ emissions from international trade-related transport could theoretically be reduced by up to 41.6%, approximately 404 million tons of CO₂. The largest reduction potential lies in maritime shipping and aviation, with potential reductions of 164.1 million tons and 155.7 million tons, respectively. This indicates that emissions from international trade-related transport are not merely an "end-of-pipe" issue but are closely related to upstream demand and the organization of trade relationships. Expanding the emission reduction perspective from transport vehicles themselves to the optimization of commodity flows and trade relations can provide new policy pathways for international freight emission reduction. Of course, the 41.6% reduction represents only a "maximum theoretical potential," as trade partnerships are determined not solely by distance but also by multiple constraints including geopolitics, resource endowments, trade agreements, infrastructure, and industrial chain lock-in.
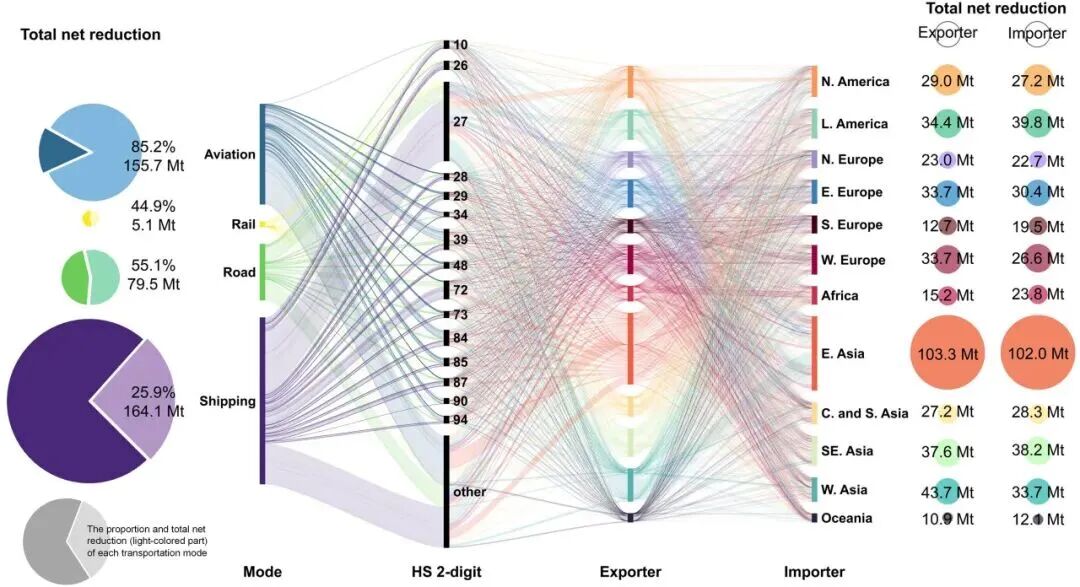
Figure 5. Theoretical potential for carbon emission reduction through trade optimization
The Sankey diagram shows net emission reductions for each "mode–product–exporter–importer" flow. Only the top 15 HS codes with the largest net emission reductions are shown individually; remaining products are grouped as "Others." The left pie chart shows emission reduction share and total net reduction by transport mode; the right bubble chart shows cumulative emission reductions by region as exporters and importers.
On April 3, these research findings were published in Science Advances under the title "Global mapping of disaggregated international trade-linked transportation CO₂ emissions."
Dr. Luo Zhenyu, a postdoctoral fellow at the School of Environment, Tsinghua University, and Su Yuhan, a 2021 master's student, are co-first authors of the paper. Professor Liu Huan is the corresponding author. The research was supported by the National Natural Science Foundation of China and the China Postdoctoral Innovative Talent Support Program.
Link to paper: https://www.science.org/doi/10.1126/sciadv.adz1670


 Latest recommendations